Introduction
Welcome to the OtasML View Data Source Page documentation. This guide will walk you through the features and functionalities available on the View Data Source page within the OtasML platform. By the end of this guide, you will understand how to review your dataset's original data, useful information, and detailed statistics.
Prerequisites
- An active OtasML account.
- Access to the OtasML platform.
- An existing data source was uploaded to the OtasML platform.
Step-by-Step Guide
- Step 1:
- Log in to your OtasML account.
- On the left sidebar, click on Data Source.
- Step 2:
- You will see a table listing all existing data sources.
- In the Actions column, click on the View icon next to the data source you wish to preview.
- Step 3:
- On the View Data Source page, you will see several sections providing detailed information about your dataset. These sections are described below:
Section 1:

- Total Rows: Displays the total number of rows in your dataset.
- Example:
Total Rows: 10,000
- Example:
- Total Columns: Displays the total number of columns in your dataset.
- Example:
Total Columns: 15
- Example:
- Missing Values: Checks if your dataset has any missing values and displays the count.
- Example:
Missing Values: 150
- Example:
Section 2:
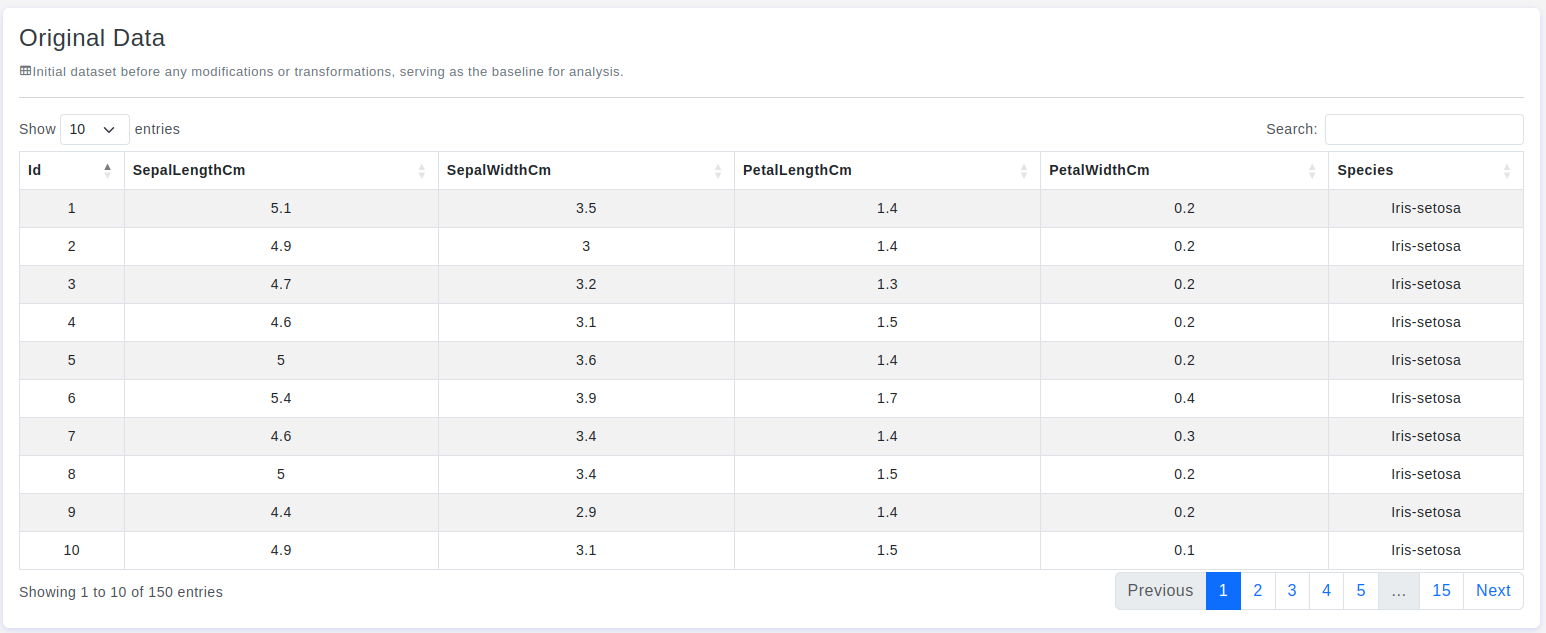
This section displays the original data from your dataset. You can review the data as it was uploaded.
- Note: The data will be displayed in a table format, similar to how it appears in your CSV file.
Section 3:
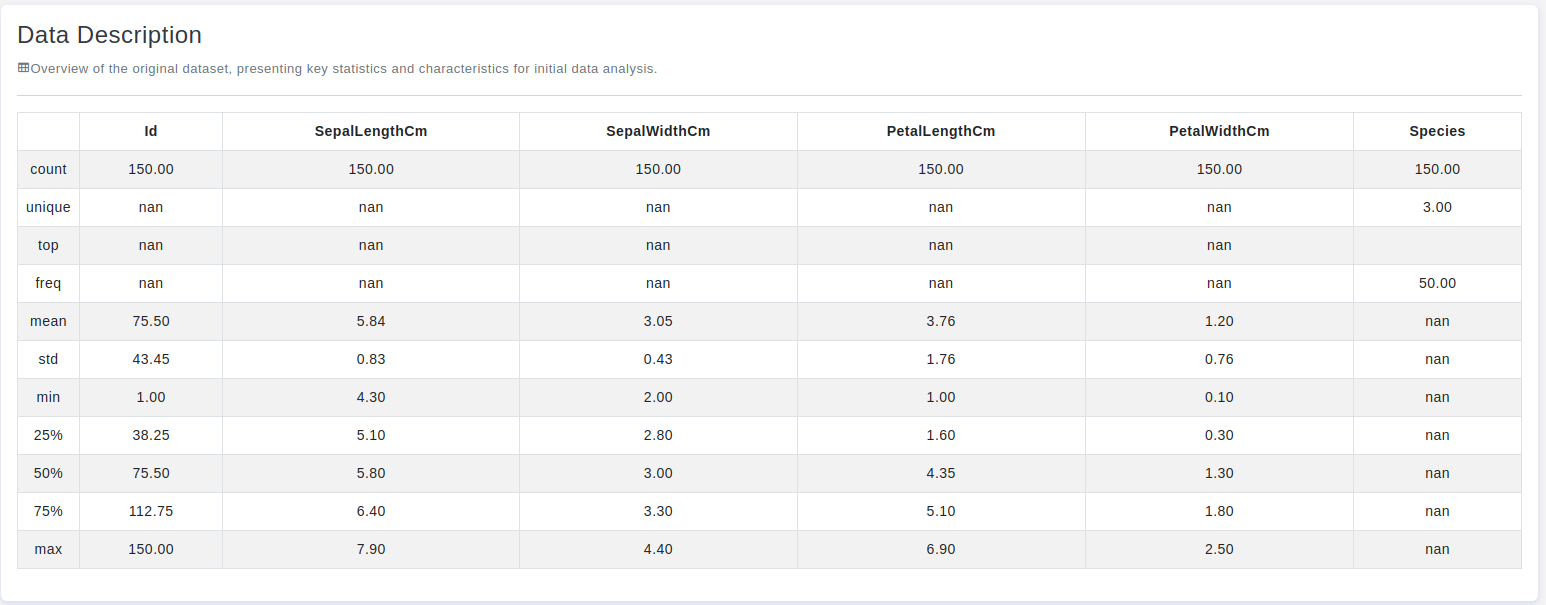
In this section, you can see detailed statistics for each column in your dataset. The statistics include:
- Count: The number of non-null entries in the column.
- Unique: The number of unique entries in the column.
- Top: The most frequently occurring entry in the column.
- Freq: The frequency of the most common entry.
- Mean: The average value of the column (for numerical columns).
- Std: The standard deviation of the column (for numerical columns).
- Min: The minimum value in the column (for numerical columns).
- 25%: The 25th percentile value in the column (for numerical columns).
- 50%: The median or 50th percentile value in the column (for numerical columns).
- 75%: The 75th percentile value in the column (for numerical columns).
- Max: The maximum value in the column (for numerical columns).
Section 4:
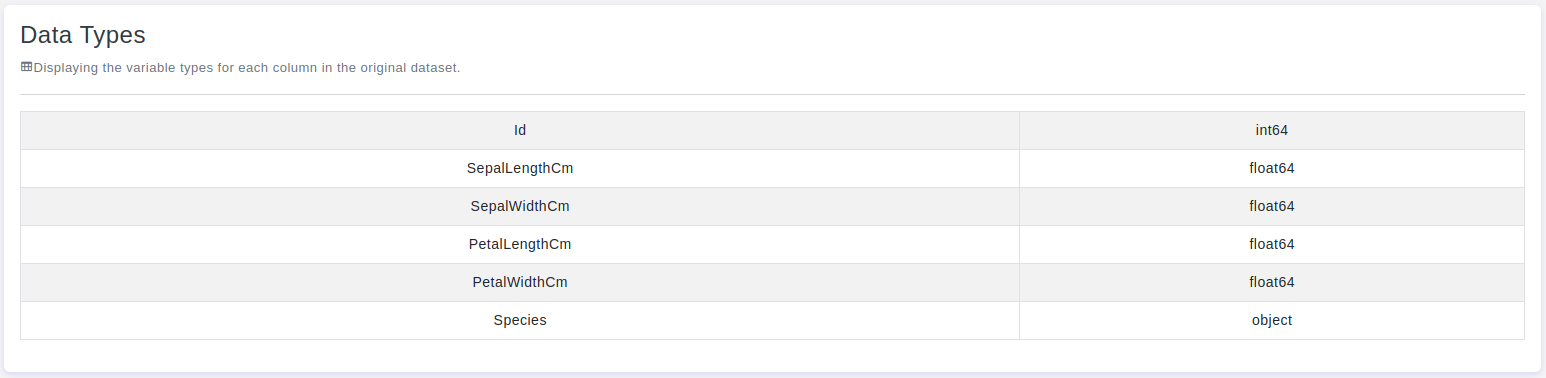
This section displays the data type of each column in your dataset. Understanding the data types helps in preparing and analyzing the data correctly.
- Example:
Column: Age, Data Type: int64Column: Name, Data Type: object
FAQs
- Q1: Can I edit the data from the View Data Source page?
- A1: No, the View Data Source page is for viewing purposes only. To edit the data, you need to upload a new dataset with the changes.
- Q2: How do I handle missing values in my dataset?
- A2: You can handle missing values by preprocessing the data in the data preparation stage of your machine learning workflow.
- Q3: Can I download the data from the View Data Source page?
- A3: No, the data is not available for download from the View Data Source page. You can re-upload your original file if needed.
Troubleshooting
- Issue: Unable to view the data source details.
- Solution: Ensure you have selected a valid data source. If the issue persists, contact support.
- Issue: Missing values count is not accurate.
- Solution: Double-check your original data file for any preprocessing issues before uploading. If the problem continues, contact support.
Contact Support
If you need additional help, please contact our support team at support@otas.ai, or please feel free to use our contact us form.