Overview
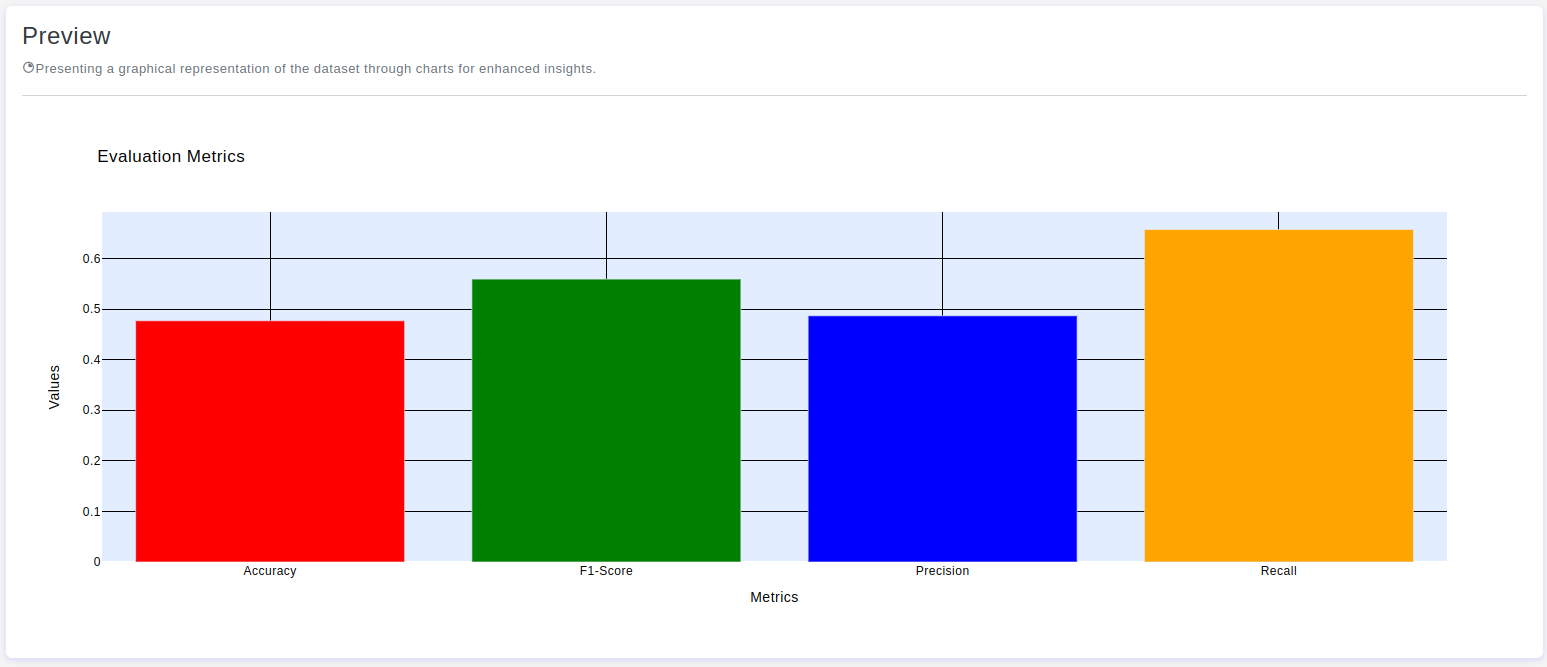
This chart provides a customizable visualization, allowing you to display various performance metrics such as accuracy, F1-score, precision, and recall, with specific colors assigned to each metric.
Chart's configurations
Height
- Default Value: 500 pixels
- Description: Provide a specific height value for the chart. Only integer values are allowed, and this will help maintain the aspect ratio of the chart.
Chart Title
- Max Length: 80 characters
- Default Value: None
- Description: The chart title is the headline of your data story. It succinctly describes the main theme or purpose of the chart, providing a quick overview of the insights presented.
- Note: You can use the tag
{{None}}to display nothing.
- Note: You can use the tag
X-axis Title
- Max Length: 80 characters
- Default Value: None
- Description: The
X-axis titlelabels the horizontal axis of your chart, providing context for the variable or time scale represented. It serves as a key reference point for understanding the data along theX-axis.- Note: You can use the tag
{{None}}to display nothing.
- Note: You can use the tag
Y-axis Title
- Max Length: 80 characters
- Default Value: None
- Description: The
Y-axis titlelabels the vertical axis of your chart, indicating the scale or measurement of the displayed data. It serves as a key reference point for understanding the data along theY-axis.- Note: You can use the tag
{{None}}to display nothing.
- Note: You can use the tag
X-axis Grid
- Default Value: True
- Description: The
X-axis gridconsists of horizontal lines on the chart, providing a visual reference for data points along theX-axis.
Y-axis Grid
- Default Value: True
- Description: The
Y-axis gridcomprises vertical lines on the chart, offering a visual guide for data points along theY-axis.
Paper Color
- Default Value: #FFFFFF
- Description: The
paper colorrefers to the background color of your paper of chart. It sets the overall visual tone and can impact the readability of your data.
Plot Color
- Default Value: #e2edff
- Description: The
plot colordefines the color scheme used for the main elements within the chart. Thoughtful selection of plot colors enhances visual appeal and aids in conveying information effectively.
Font Color
- Default Value: #000
- Description: The
font colorrefers to the color of the text within your chart, including titles, labels, and annotations. Selecting an appropriate font color is essential for readability and ensuring that the text stands out against the background.
X-axis Grid Color
- Default Value: #000
- Description: The
X-axis grid colorrefers to the color of the horizontal grid lines on the chart. It provides a visual reference for data points along theX-axis, aiding in interpretation.
Y-axis Grid Color
- Default Value: #000
- Description: The
Y-axis grid colorpertains to the color of the vertical grid lines on the chart. It serves as a visual guide, aiding in the interpretation of data points along theY-axis.
Accuracy Color
- Default Value: #FF0000
- Description:
Accuracy colorrefers to the specific color assigned to bars representing accuracy values. This color serves as a visual indicator, allowing users to quickly identify and assess accuracy levels within the chart. Choose a color that aligns with your design preferences and effectively communicates the significance of accuracy in the context of your data presentation.
F1-Score Color
- Default Value: #008000
- Description:
F1-Score colorin a chart refers to the specific color assigned to representF1-Scorevalues. This color enhances visual distinction, aiding you in quickly identifying and evaluatingF1-Scoreperformance. Carefully choose a color that aligns with your design choices and effectively communicates theF1-Scoresignificance in the context of your data visualization.
Precision Color
- Default Value: #0000FF
- Description:
Precision colorin a chart refers to the specific color assigned to representprecision values. This color serves as a visual cue, allowing you to easily identify and assess precision levels within the chart.
Recall Color
- Default Value: #FFA500
- Description:
Recall colorin a chart refers to the specific color assigned to representrecall values. This color enhances visual clarity, enabling you to swiftly identify and evaluate recall performance.