Overview
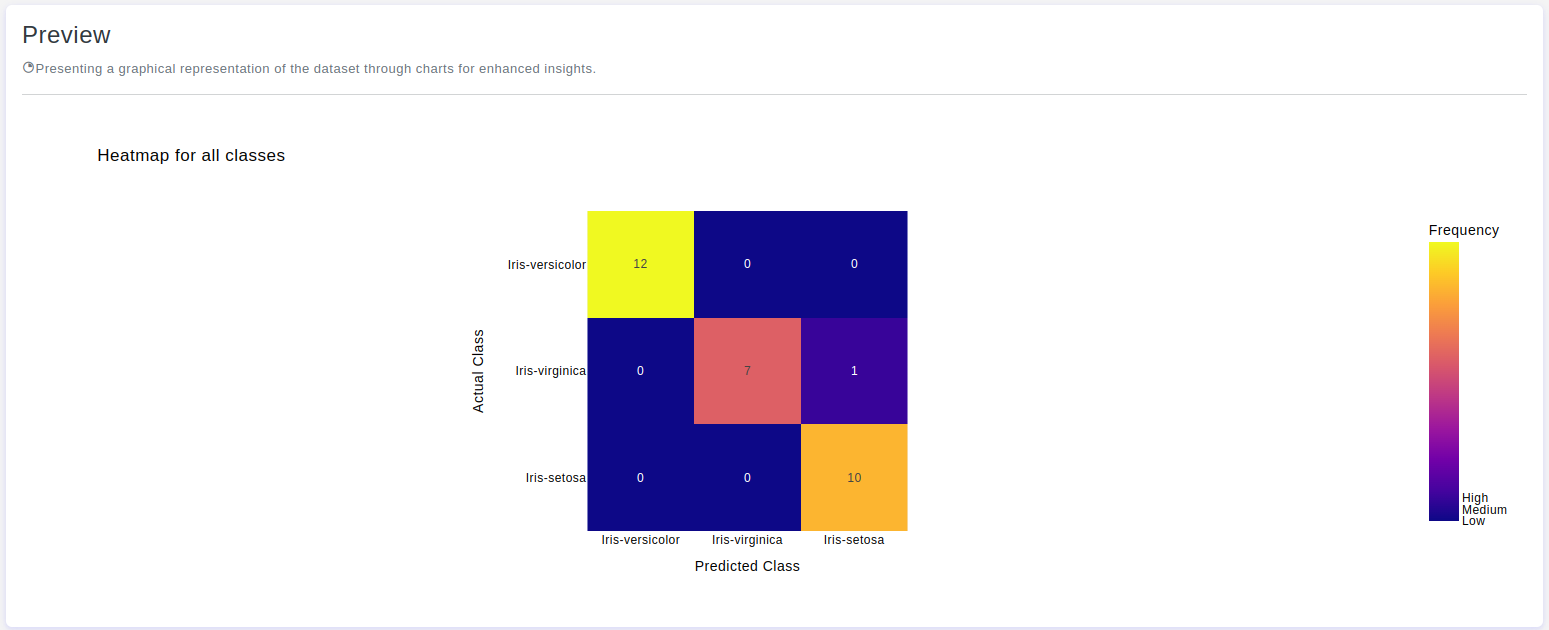
This chart displays a heatmap representation of the confusion matrix, providing a visual interpretation of the model's performance across all classes.
Chart's configurations
Height
- Default Value: 500 pixels
- Description: Provide a specific height value for the chart. Only integer values are allowed, and this will help maintain the aspect ratio of the chart.
Chart Title
- Max Length: 80 characters
- Default Value: None
- Description: The chart title is the headline of your data story. It succinctly describes the main theme or purpose of the chart, providing a quick overview of the insights presented.
- Note: You can use the tag
{{None}}to display nothing.
- Note: You can use the tag
X-axis Title
- Max Length: 80 characters
- Default Value: None
- Description: The
X-axis titlelabels the horizontal axis of your chart, providing context for the variable or time scale represented. It serves as a key reference point for understanding the data along theX-axis.- Note: You can use the tag
{{None}}to display nothing.
- Note: You can use the tag
Y-axis Title
- Max Length: 80 characters
- Default Value: None
- Description: The
Y-axis titlelabels the vertical axis of your chart, indicating the scale or measurement of the displayed data. It serves as a key reference point for understanding the data along theY-axis.- Note: You can use the tag
{{None}}to display nothing.
- Note: You can use the tag
Paper Color
- Default Value: #FFFFFF
- Description: The
paper colorrefers to the background color of your paper of chart. It sets the overall visual tone and can impact the readability of your data.
Plot Color
- Default Value: #e2edff
- Description: The
plot colordefines the color scheme used for the main elements within the chart. Thoughtful selection of plot colors enhances visual appeal and aids in conveying information effectively.
Font Color
- Default Value: #000
- Description: The
font colorrefers to the color of the text within your chart, including titles, labels, and annotations. Selecting an appropriate font color is essential for readability and ensuring that the text stands out against the background.