Overview
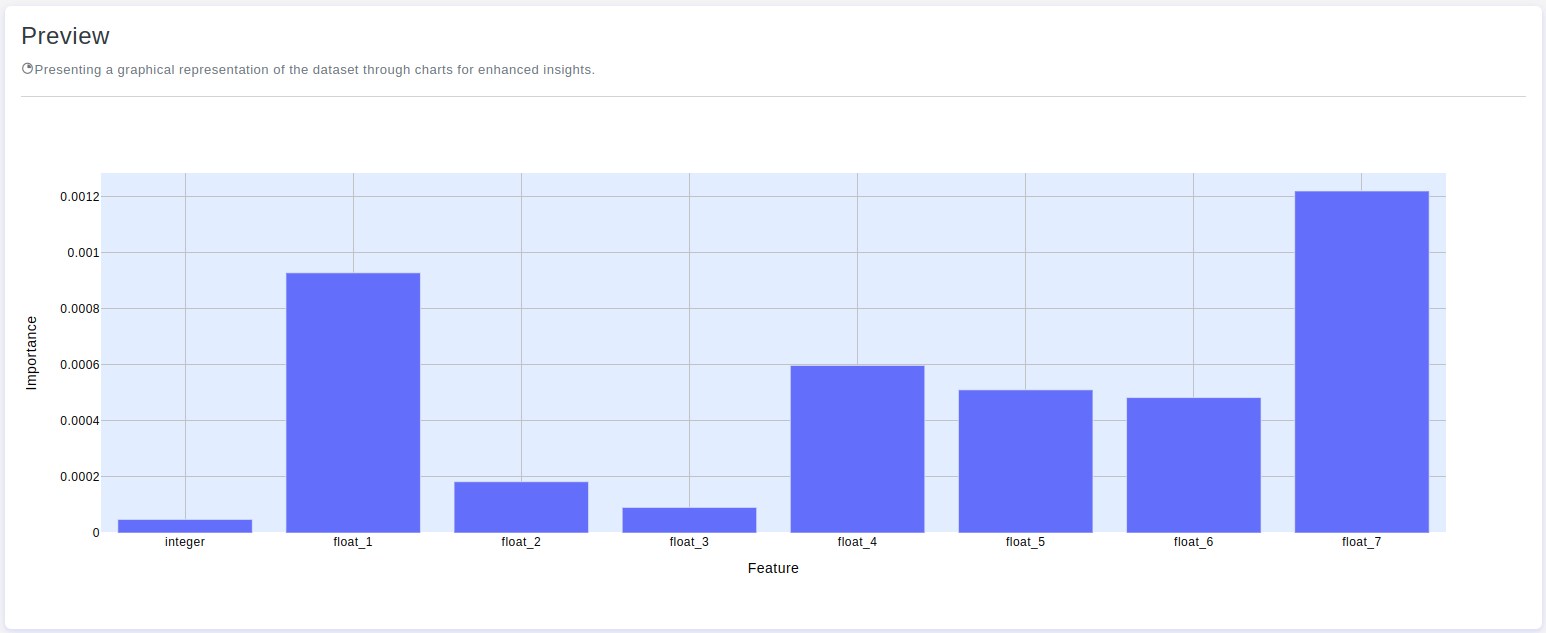
The Feature Importance Binary chart visualizes the significance of features in a binary classification model. It illustrates the importance of each feature in determining the binary outcome, helping users identify which features have the most influence on the classification. With adjustable parameters such as height, legend display, gridlines, and color schemes, users can customize the chart to effectively communicate insights from their binary classification models.
Chart's configurations
Height
- Default Value: 500 pixels
- Description: Provide a specific height value for the chart. Only integer values are allowed, and this will help maintain the aspect ratio of the chart.
Show Legend
- Default Value: True
- Description: Refers to the option of displaying a key or legend on the chart. This legend provides information about the meaning of different colors, shapes, or symbols used in the chart, helping viewers interpret the data accurately. Enabling the
Show Legendfeature enhances the clarity and understanding of the chart, making it easier for the audience to associate visual elements with specific categories or data points.
X-axis grid
- Default Value: True
- Description: The
X-axis gridconsists of horizontal lines on the chart, providing a visual reference for data points along theX-axis.
Y-axis grid
- Default Value: True
- Description: The
Y-axis gridcomprises vertical lines on the chart, offering a visual guide for data points along theY-axis.
Chart title
- Max Length: 80 characters
- Default Value: None
- Description: The chart title is the headline of your data story. It succinctly describes the main theme or purpose of the chart, providing a quick overview of the insights presented.
- Note: You can use the tag
{{None}}to display nothing.
- Note: You can use the tag
X-axis title
- Max Length: 80 characters
- Default Value: None
- Description: The
X-axis titlelabels the horizontal axis of your chart, providing context for the variable or time scale represented. It serves as a key reference point for understanding the data along theX-axis.- Note: You can use the tag
{{None}}to display nothing.
- Note: You can use the tag
Y-axis title
- Max Length: 80 characters
- Default Value: None
- Description: The
Y-axis titlelabels the vertical axis of your chart, indicating the scale or measurement of the displayed data. It serves as a key reference point for understanding the data along theY-axis.- Note: You can use the tag
{{None}}to display nothing.
- Note: You can use the tag
Paper color
- Max Length: None
- Default Value: #FFFFFF
- Description: The
paper colorrefers to the background color of your paper of chart. It sets the overall visual tone and can impact the readability of your data.
Plot color
- Max Length: None
- Default Value: #e2edff
- Description: The
plot colordefines the color scheme used for the main elements within the chart. Thoughtful selection of plot colors enhances visual appeal and aids in conveying information effectively.
Font color
- Max Length: None
- Default Value: #000
- Description: The
font colorrefers to the color of the text within your chart, including titles, labels, and annotations. Selecting an appropriate font color is essential for readability and ensuring that the text stands out against the background.
X-axis grid color
- Max Length: None
- Default Value: #C2C2C2
- Description: The
X-axis grid colorrefers to the color of the horizontal grid lines on the chart. It provides a visual reference for data points along theX-axis, aiding in interpretation.
Y-axis grid color
- Max Length: None
- Default Value: #C2C2C2
- Description: The
Y-axis grid colorpertains to the color of the vertical grid lines on the chart. It serves as a visual guide, aiding in the interpretation of data points along theY-axis.